

This is a client-based imagemap – click on a buoy for more information…
There is a more dynamic Java2 version of this page that contains more buoy information.
Notes:
- Maps of California and Northern California are available.
- In addition, a Buoy Summary (Java) and Buoy ID list are available.
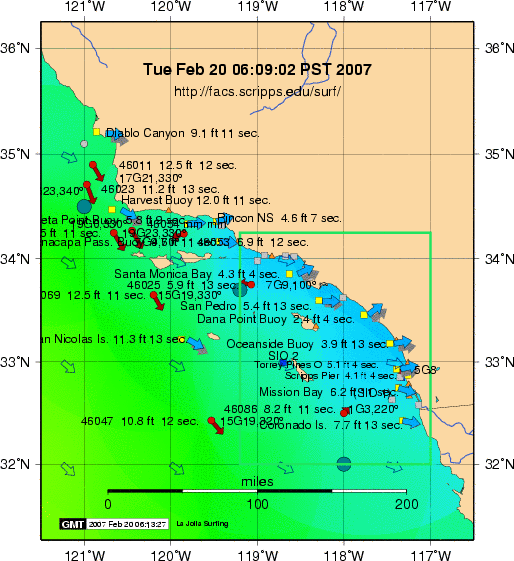
- The large blue-green circles are links to the polar spectral plots generated from the NOAA WaveWatch III model at the indicated location.
- FAQ – the distance from Scripps Pier to the Harvest buoy is 226.5 miles (196.8nmi).
- The NOAA Moored buoy data wind direction is now plotted from the new text field format in degrees rather than from a table of angles (N, NW, etc., etc.).
- Missing data: This occurs from time to time as data is unavailable from CDIP or NOAA. It will usually reappear within a few hours. Check the NOAA NDBC Buoy Status for detailed information on the status of any NOAA moored buoy.
- NDBC Station Maintenance Update – check here for the latest on the vanishing NOAA buoys.
- The red circles represent the NOAA moored buoys. The yellow squares represent CDIP buoys/stations, and the green diamond CICESE in Mexico. The orange triangles are USCG stations. When directional data are present, a blue arrow is drawn showing the mean swell direction for the CDIP stations at Santa Cruz, Diablo Canyon, Harvest Buoy, Huntington Beach, and San Clemente. The mean wave angle for the Harvest platform is indicated by the large light blue arrow in the lower left of the map. The sustained wind is plotted with a dark red vector indicating direction – 1/10 inch is 10 knots. The NWS 24hr Sea Wave Forecast with swell direction is plotted using green vector arrows and labelled with the mean swell direction. In summary, blue arrows represent the observed average direction and green arrows the predicted direction.
- A PostScript version of the current image is also available.
- Data is compiled and plotted every 15 minutes courtesy:
- National Data Buoy Center
- NOAA NWS Interactive Marine Observations, Tallahassee, Florida
- Scripps Institute of Oceanography (SIO) Weather
- Coastal Data Information Program (CDIP)
- Center for Coastal Studies – SIO
- GMT-3 (Generic Mapping Tools) – SOEST University of Hawai`i